How to Build a Financial Forecast & Set Investor Expectations for Your First Fundraise

VIDEO TRANSCRIPT

This is Neil Portus from Tailored Partners. I work as a freelance CFO for growth companies. This video is for startup founders & SME business owners to show them how to build a financial forecast and set investor expectations for their first fundraise. I’m going to walk you through my “1-5-10 Framework.” Let’s dive in!

My 1-5-10 Framework:
Year 1: Keep It Achievable
Years 2-3: Demonstrate Scale
Year 5 (+/- 1-2 years): Deliver Results
Year 10: Change The World!

MY 1-5-10 FRAMEWORK

Okay, the 1-5-10 in my framework refers to Year 1, Year 5 and Year 10 of the forecast.

Year 1

Starting with Year 1, I call this “Keep It Achievable.” I think the key here is the make the Year 1 forecast something you are confident you can achieve because you don’t want investors to be disappointed right out of the gate. There are always unforeseen challenges right after a fundraise so give yourself margin. Investors will focus more on the Year 5 numbers where they are looking for their return & we’ll touch on that shortly. But I have seen forecasts that are best case and frankly too optimistic in the first year which led to investors being disappointed right from the start and a company’s founders playing catch up from the get-go. So, focus your investors attention on the on the Year 5 forecast & give yourself something you can achieve in Year 1.

Years 2-3

OK before we get to the Year 5 forecast let’s look at Years 2-3 and I call this “Demonstrate Scale.” This is the bridge from the achievable Year 1 forecast to the Year 5 forecast that will deliver on what your investors want. The key to this section is that the model should show how the business will scale here. For example, how user acquisition will accelerate or economies of scale will develop. Know the key metrics that you’ll want investors to focus on and let those be the ones that you benchmark against. Pick measurable ones which show business performance; not too many though to keep the messaging as simple as possible.

Year 5

Next is Year 5 which is the most important part. I call this “Deliver Results.” This is the time frame when investors will be looking to realize their return. Here, it’s vital that you research and understand WHO your target investor is and know WHAT return they’ll be seeking and WHEN they will want that return. For example, a Private Equity investor who invests in more established businesses may be seeking a 3 times return in 5 years on their investment. While a Venture Capital investor, whose investments in startups are riskier, may be looking for a higher 10 times return since they’ll need to balance out the zeros they get on their startups that fail. Your model needs to show how your business will get to your target investors level of return. If your business won’t get there, it’s going to be tough to gain traction with those investors.

Also, you see it actually says Year 5 “+/- 1 to 2 years.” Depending on your type or stage of company, an investor maybe looking to realize their return as early as Year 3 or as last as Year 7. Of course some projects – an infrastructure project for example – may fall outside of this time window. But 5 years plus or minus a year or two is generally what I see the most.

One more thing I want to add here which is about setting expectations – and that is don’t over-promise. I think I want to show return that meets but is not significantly higher than your investor’s target return. You might think the more the better, however, if you set a high bar you’ll have to live up to those expectations later on. Remember that investors are investing for other reasons too such as a great team or product. If your business can demonstrate their target return in the right time frame, I think you have shown what you need to right now. If you think there is significant upside to their target return and you want to highlight that perhaps speak to upside levers or potential that’s not incorporated in the model but available to the business.

Year 10

Finally, let’s look at Year 10. I call this “Change The World” and this is a HUGE vision for the business. Some investors may want to get a sense for how big the business could get especially for startup. And this is where your business will “change the world” 🙂 and what those numbers would look like. I wouldn’t try to show this in the Year 5 numbers. Again, don’t over-promise. And your model doesn’t need to go out this far to Year 10 but rather I would have a metric or two to speak to perhaps a revenue/sales or number of users that you can aspirationally believe you can reach.

AN EXAMPLE

OK let’s put all this into a quick example! Let’s say you are launching a store to sell electric bikes which are gaining popularity – and you want to launch by raising $500K on a $4M post-money valuation which yields a 12.5% ownership stake for an investor or investor group who we’ll call Investor A.

Example year 1

For Year 1, let’s “Keep It Achievable.” You forecast one ‘small size’ format store with revenues of $150K that’s 300 bikes sold for $500 each or less than a bike a day. An upside lever here to speak to could be that only bike sales are shown so any accessory sales such as helmets will offer upside potential to your numbers.

Looking ahead at the end of Year 1, you expect that you will need to raise again to fund growth. You forecast needing to raise $1M @ 18 months on a $6M post-money valuation which is an 8 times multiple on Year 3 forward revenues of $750K. Investor A is not expected to participate in this round and is diluted to a 10.4% ownership stake.

Example year 2

Looking at the forecasts in this period. In Year 2, you are still just operating one small size store with revenues forecasted to be $300K. That’s +100% year-over-year growth & 600 bikes sold for $500 each and metrics that you could show scale with could be strong revenue growth, customer growth & cash flow break-even at the end of the year.

Example year 3

Looking at Year 3, you have used that new capital to expand your one store to a larger size store which will generate revenues of $750K that’s +150% year-over-year growth & 1,500 bikes sold for $500 each. Metrics showing scale could be accelerating revenue growth, new customer acquisition & being cash flow positive for the full year.

Example year 4

Year 4 is when we plan to “Deliver Results.” At the start of Year 4, you expect that you’ll need to raise again to fund continued growth. You forecast you expect that you’ll need to raise $2.5M at the start of Year 4 on a $16M post money valuation which is an 8 times multiple on Year 4 revenues of $2M. You expect Investor A not to participate again and be diluted down to an 8.8% ownership stake.

For Year 4, you’ve used your capital to expand to 2 stores both at the larger expanded size with a combined. total revenue forecast of $2M. That’s +167% year-over-year growth & 4,000 bikes sold for $500 each. Now revenue growth is driven by volume – not price – in your model so an upside lever available to speak to would be that you could raise prices. Investor A’s 8.8% ownership stake is worth $1.4M yielding a 41% return on their $500K investment. That’s right in line with a 40% return your research shows that they’ll be seeking after 3 years of operations.

Example year 10

Finally, for the investor who wants to see how big this can get, you can speak to the long-term 10-year growth plan the huge vision that you have for the company where you’ll be operating in 3 states by then – NY, CA and TX – which all have 11 cities with 1M+ people. You expect that your branding, locations, people & product strength will create the market leading position and you’ll be operating 15 stores at that time with a revenue forecast at $25M which you believe will expand your multiple to 10X yielding a $250M dollar valuation.


Copyright 2020 Neil Portus | Please see our disclaimers.

How To Be Your Own Startup CFO

VIDEO TRANSCRIPT

This is Neil Portus from Tailored Partners. I work as a freelance CFO for growth companies and this video is on how to be your own startup CFO.

This videos for founders who are bootstrapping it and wearing a lot of hats as they launch. For many, a VP of finance or a CFO is a later stage hire and founders often find themselves handling the accounting and finances at the start. So I want to show the 10 things that I think they should focus on. Let’s dive in.

1. Bank Accounts and Credit Cards.

You’ll need to get these set up and protect access to them. Protect who can send and receive money. One great option is to provide read-only access to certain individuals like your bookkeeper and credit cards are great and useful to start collecting points and earn cash back for your expenses.

2. Accounting Software.

This is the heart of your financial operations and leading ones to consider at this stage include Xero and Quickbooks. You want to properly assign access here as well as this is very sensitive information. You’ll want to link this to your credit cards and bank accounts so all those transactions get automatically downloaded.

3. Payroll Service.

This sets up a monthly payroll cycle and also calculate and pays your federal and state payroll taxes. You can also consider utilizing a provider like TriNet or Justworks which in addition to payroll can also offer group benefits like healthcare and 401k.

3B. Hiring Employees.

If you plan to hire employees, be sure to get your state unemployment ID numbers and have a starter set of hiring forms: W4, I9 and an employee information sheet for each new hire. Make sure you understand the Fair Labor Standard Act as you determine salaried vs. hourly workers, overtime and record-keeping requirements.

4. Accounts Receivable.

This is about getting paid. Create invoices in your accounting software and send them to your clients. Set your payment terms to be as tight as commercially possible and assign someone to follow up on overdue invoices.

5. Accounts Payable.

This is about paying your bills. Negotiate your payment terms to be as generous as commercially possible. For larger bills, spread them out over the months that you use the service by creating bills in your accounting software for those in-between months. Create an email address such as accounting@ or billing@ to stay organized and receive all of your bills. Be sure to send and collect vendor W-9 forms and enter those into your accounting system so you can stay organized and make the year end 1099 process a lot easier.

6. Cash Reconciliation.

You should perform a cash reconciliation at the end of each month. For a start-up, this is akin to “closing the books.” You’re accounting software should download all the credit card and bank transactions but you need to make sure that they’re properly categorized. The balance on your bank statement at month end should match what’s in your accounting software to the penny to show that you have everything accounted for. If you feel comfortable, do this yourself. But, if not, hire an hourly bookkeeper to do it.

7. Financial Model and Cap Table.

Build and maintain a financial model. Externally for investors but internally for your own cash management, budgeting and hiring plans. Also maintain a cap table to track your equity ownership and make sure that everyone is on the same page as to who owns what.

8. Budget to Actual.

Compare your monthly results with your budget for the month. See how you’re doing and pare back expenses if you’re over budget. Doing this with a monthly rhythm will give you enough time to course-correct if something big is off.

9. Year End.

Hire a tax firm to prepare your taxes. Be sure to understand what documents you’ll need to collect and retain throughout the year. Be sure your accounting software or payroll service will prepare the 1099s for independent contractors and W-2s for employees. But be sure to double-check them for accuracy.

10. Insurance.

As you reach a certain size, you should find a broker to help you obtain general liability insurance for your business and directors and officers (D&O) insurance for your Board.

One Final Note.

If you’re spending more than 5 hours a week on these tasks it may be time to hire a part-time CFO. Give me a call!


Copyright 2020 Neil Portus | Please see our disclaimers.

This Analysis is for Brick & Mortar Business Owners to Show the % Occupancy Level Where They Turn Profitable During Covid-19 Social Distancing


Visit our store to download a free copy of the CONTRIBUTION MARGIN spreadsheet.

VIDEO TRANSCRIPT

This is Neil Portus from Tailored Partners. I work as a freelance CFO for growth companies.

As government’s make plans to reopen businesses following Covid-19 closures, capacity levels at many brick-and-mortar businesses may be limited by law or by new consumer habits or both. Hotels, restaurants, coffee shops, retail stores and music venues may operate at limited capacity to allow for social distancing.

So, I want to show an analysis that can help brick-and-mortar business owners understand the percent capacity at which they can operate profitably. It’s a unit contribution margin analysis. Let’s go ahead and dive in.

Two points to start. First, this is a unit economics analysis because we want to know the number of units or in this case the number of customers that we need to be profitable. Second, we’ll need separate our variable costs from our fixed costs. Variable costs are those driven by volume while fixed cost will be incurred no matter how many people are in our store. Rent is a good example of a fixed cost. This is why I want to show a unit contribution margin analysis.

Contribution margin is simply revenues generated from a sale or order minus the variable cost of a fulfilling that order: materials, wages, etc. Here’s a simple, made up calculation shown on a per unit or per customer basis. This business makes $11 in revenue per customer on average with $5 of variable costs, leaving a $6 unit contribution margin.

Now, let’s put this into an analysis for a business owner to use. Pick a time period that you’re considering reopening – let’s say June. Now, I think you’ll want have an understanding of the number of customers that you serve when operating at full capacity. Perhaps we had 1,000 customers in June last year but this June we may only operate at 35% capacity. That means we’re only expecting 350 customers. If we use the $6 unit contribution margin that we calculated before times 350 expected customers our gross contribution margin is going to be $2,100. Next we need to subtract our fixed costs which we estimate to total $3,000. So, here we see that at 35% capacity we’ll operate at a loss of $(900). But if we move the percent occupancy up to 50% we see that means we are now expecting 500 customers and our gross contribution margin increases to $3,000 which equals our fixed cost and means that we’ll break even. Once we move the occupancy above 50%, we see that we start to turn a profit. So, at 50% capacity we break even and above that we start to turn a profit.

Now one final thing – even if you don’t have exact numbers on a per-unit basis, I think that even a rough picture will still be a helpful guide. Even with perfect numbers an analysis like this won’t be the only reason to reopen at a certain time. Just one of the many factors supporting a decision of when to open.


Copyright 2020 Neil Portus | Please see our disclaimers.

The Most Powerful Excel Formula for Startup Founders and Business Owners During Covid-19


Visit our store to download a free copy of the =CHOOSE formula spreadsheet.

VIDEO TRANSCRIPT

This is Neil Portus from Tailored Partners. I work as a freelance CFO for growth companies and I wanted to share what I think is the most powerful, most valuable Excel formula right now during Covid-19:

And that’s the =CHOOSE formula.

So, this video is for startup founders and business owners to show them how they can take their existing Excel budgets and models and by adding in the =CHOOSE formula to their key drivers & their key assumptions model out different revenue and expense scenarios in order to see the impact on the bottom line and make important planning decisions for their company. All in about a minute. Let’s dive in.

Ok, here’s a simple profit and loss statement down to operating income. I’m going to paste in the three scenarios I want to test. I’ll start entering my =CHOOSE formula. The first cell reference will be the one that we will use the toggle between the three scenarios. I’ll lock in that cell reference by hitting F4 which puts those two dollar signs there. You’ll see that I’m using the =CHOOSE formula for each key driver in this model: number of units sold, price per unit, cost per unit & each of the key operating expenses. No need to do every possible input; just focus on the important ones that drive the model. Also, you can have as few or as many scenarios as you want just separate each one with a comma in the formula. I’ll copy this formula down to the rest of the operating expenses and make all these fonts black now that they’re formulas.

Now, we are ready to toggle between our three scenarios to see the impact on operating income.


Copyright 2020 Neil Portus | Please see our disclaimers.
Applying Bacon’s Law (aka Six Degrees of Kevin Bacon) to #WFH Business Development in 2020


This article was featured on the Autonomy.Paris Urban Mobility Daily newsletter.

Covid-19 and the shelter-in-place orders that followed have forced many of us to work from home, popularizing the #WFH hashtag. Virtually every role at every company has been affected as a result.

One role in particular that has seen tremendous impact is that of business development. The familiar ways of developing and closing on new business have vanished: in-person meetings, networking events, trade shows and conferences. A phone or video call used to only be the initial set up to an in-person meeting.

With so many businesses retrenching and cutting costs, for those of us working from home who are fortunate enough to be safe and healthy, taking this time of self-isolation to actively plan for the future and new ways of generating income is very top of mind.

However, the old playbook will not work. In fact, striking the wrong chord may cause more harm than good. Personally, I’ve seen more #Fails than #Wins from the outreach emails I’ve received during this time from communication that ignores our current state or pushes a product that’s currently irrelevant. Business development in this time can be daunting.

That said, new opportunities will emerge. There may be a new normal but there will be opportunities to do good work and build and sell good products. Mobility, as much as any other industry, is facing massive disruption which will lead to new innovation.

So, with all of this opportunity ahead, how does one thoughtfully think about business development in 2020?

I wanted to share my personal framework which is based on “Bacon’s Law” stemming from folklore surrounding the American actor, Kevin Bacon. The basic idea is that you are connected to any other person on Earth through six or fewer people. It’s this concept that I think applies to business development during and emerging from Covid-19 (and I think can also apply to anyone job searching in this time). Here’s how I see it:

0 Degrees of Seperation: Start with Who You Know

These are the people you already know simply put. The people you have met or, better yet, worked with before. These connections are formed and you can pick things up with a phone or video call. Even better, many of them probably want to hear from you during these isolating times! This group is your best bet to form something new and move forward. I would be reaching out and checking in with this group and exhausting all possibilities before moving forward anywhere else.

1 to 2 Degrees of Separation: Showcasing the Urban Mobility Challenge

Looking beyond your “0 Degree” contacts has potential but it’s worth proceeding cautiously.

My first thought is to approach your closest “0 Degree” connections for referrals and introductions. For my own CFO-services consulting business, Tailored Partners, referrals have been my greatest source of new clients. I expect that to continue in 2020.

However, there may come a time when you’ve exhausted your “0 Degree” connections and their potential for introductions and referrals. This is where I believe something innovative like the Urban Mobility Challenge comes into play and is worth showcasing as a prototype.

Just launched by the Urban Mobility Company and inaugurated by the Nissan Innovation Lab, the all-digital Urban Mobility Challenge is an example of an offering well suited for any time – but certainly uniquely well positioned for business development in 2020.

Briefly, the Urban Mobility Challenge is a 3-step program designed to allow companies to quickly discover, meet and select the most innovative startups with which to develop a proof of concept. It’s a digital funnel which provides exclusive access to Autonomy’s community of +10,000 startups from around the world. The Urban Mobility Company takes care of everything from beginning to the end and all pitch sessions and meetings are done virtually. Further, corporate partners and winning startups will be promoted through content pieces distributed to the Urban Mobility Company’s audience of more than 10,000 professionals via its digital content platforms the Urban Mobility Daily and the Urban Mobility Weekly and showcased at Autonomy 2020’s Startup District this November 4-5, 2020.

I think the value proposition is compelling. You can access and leverage Autonomy’s entire ecosystem, which has taken years and millions of Euros to build, in a span of weeks and for a relatively lower cost. For many companies, I think that will be a valuable trade (and perhaps covered not through new spend but by repurposing existing budget that may be underutilized or not used).

Further, the startups you meet may be more eager than you to connect as they too are seeking new partnerships in this time. You know Autonomy, they know Autonomy and you can both leverage the trust in that relationship to build something new together. It seems like the ingredients for a win-win outcome.

3-6 Degrees of Separation: Content is King

Looking out to contacts that are 3-6 degrees of separation away, personally, I think the best way to reach and engage this group will be through creating and distributing valuable content.

In-bound communication from a person or company you don’t know is a quick delete and unsubscribe for me right now.

However, new content that solves a problem or addresses something of interest is king. Cash is king they say. That certainly is still true today but perhaps we can also say that content is king too.

The most valuable content to me right now is that which I’ve sought out and solves a problem for me. I think that content which meets an interest or need is going to win new attention which can translate into new business. People are looking for solutions and, if you can provide that, you will be winning new customers.

It’s worth noting that the Urban Mobility Challenge’s value proposition extends here to 3-6 degrees of separation through its co-creation of relevant content and distribution through the Urban Mobility Daily & Weekly channels, vastly expanding the reach of your group of 3-6 degree contacts.


Copyright 2020 Neil Portus | Please see our disclaimers.
How to Value a Startup


Visit our store to download a free copy of this presentation on “How to Value a Startup.”
This article was featured on the Autonomy.Paris Urban Mobility Daily newsletter.

This year’s Autonomy & Urban Mobility Summit and companion Funding the Movement program provided a strong focus on up-and-coming mobility startups with over 120 early-stage companies attending, pitching or exhibiting.

With this focus on emerging companies and disruptive technology, I was invited to speak at the conference on “How to Value a Startup” in order to walk mobility innovators, policy makers and industry experts through my four-question valuation framework for a startup: (1) What are comparable companies worth? (2) What is the investor’s target return? (3) How viable is the customer acquisition strategy? and (4) Are expectations set too high?

Below are key highlights from my talk but be sure to visit our store to download a free copy of the full 75-slide presentation. I wrote it with a lot of detail and examples so it could be a helpful resource to those unable to attend in-person.

Key Highlights – How to Value a Startup

In speaking on startup valuation, it’s helpful to lay a bit of groundwork. Valuing companies is not easy as information is limited and fragmented. This is why investors frequently employ The Mosaic Theory which is a research approach whereby one arrives at an asset value by piecing together bits of available information. My perspective is that, if done in isolation, two people can often come up with a different valuation for a company. For an investor who has an in-depth understanding of a specific industry or sector, this limited availability and fragmentation of information is often what can provide them the edge to garner an outsized return on investment.

Additionally, valuation is only one of the key investment factors considered by early-stage investors. In my view, the quantitative and qualitative factors at play include:

  • Quantitative:
    • Revenue growth;
    • Customer churn;
    • Barriers to entry;
    • Market size/potential; and
    • Valuation.
  • Qualitative:
    • Strength of the management team; and
    • Uniqueness/long-term sustainability of the business idea.

With that groundwork set, I value startups by answering four questions:

1) What are comparable companies worth?
2) What is the investor’s target return?
3) How viable is the customer acquisition strategy?
4) Are expectations set too high?

The first two questions are more quantitative while the second two questions are more qualitative.

(1) What are comparable companies worth?

In this first step, we want to determine what other investors have paid for comparable businesses. A comparable business (sometimes called a “comp” or “comps” when referring to the whole peer group) is one that shares the same or similar: (a) industry, sector or subsector; (b) geography; (c) business model and/or revenue model; and (d) growth rate. Here, you don’t have to tick every box but you want to tick a lot of them. The reason “comps” are important is that investors often give the “market” credit that it broadly knows what it’s doing. So, the starting point for an investor is often what another investor has recently paid for something similar.

Selecting the peer group of comparable companies is the critical step. I generally see three paths based on the amount of information available:

  • Path 1: There are publicly traded comparable companies where a good amount of information is available; in the presentation, I walk through an example for luxury carmaker Aston Martin.
  • Path 2: There is a limited amount of information available for private comparable companies available through news reports and press releases; in the presentation, I walk through an example for Lyft and Uber.
  • Path 3: There is almost no information available from private comparable companies; in the presentation, I walk through an example for peer-to-peer car sharing startups comparable to Turo or Getaround.

For startups, investors will primarily focus on revenue growth as they want to know how big can this startup get. As a result, investors will generally value startups using a revenue multiple. As companies mature, investors will increasingly focus on profit growth. Here, investors start to look at multiples of cash flow or net income/earnings per share.

In my work with startup founders, I’ve found that one of the more helpful takeaways for them is that they can have an active voice in which companies comprise their peer group. Perhaps they are in an emerging sector with few existing, comparable companies or perhaps they believe their company has a disruptive technological or delivery angle which warrants a premium to other companies in the marketplace. Founders can influence valuation by identifying and supporting a peer set of comparable companies with more attractive valuations.

Once investors derive a revenue multiple from a peer group of comparable companies, they may adjust it higher or lower based on several factors. Potential discounts include if the startup is growing at a slower rate than peers as well as for a lack of liquidity if a set of public comparable companies is used to value a private company. Potential premiums include if the startup is growing faster, it may warrant a higher multiple than peers.

(2) What is the investor’s target return?

Given the risk profile of early-stage companies, investors frequently come to the table with a high bar for their target return. The question is, if private equity investors (who invest in more mature, private companies) often target a 3X return, how does an early stage investor achieve a similar return if +50% of startups fail?

Since a lot of startups fail, investors need the ones that succeed to do really well. So, for example, an early stage investor who targets a 10X return on each investment will achieve a 5X return on their portfolio if half of the companies fail.

An investor will receive an increased ownership stake in the startup for the same dollars invested as the valuation decreases. The net result is that an investor’s higher target return (i.e. 10X) can put a cap on the round’s valuation multiple.

In the presentation, I walk through a detailed example as to how an investor would calculate a 10X return and how this might result in a cap on the valuation multiple.

(3) How viable is the customer acquisition strategy?

This begins the more qualitative third and fourth questions in my framework.

Here, I seek to understand what can the startup provide to support its growth profile because, without meaningful support, I believe investors will be skeptical. A couple of key questions I ask include:

  • Is someone on the team experienced in leading customer acquisition?
  • Do they have a measurable and thought-out process – i.e. a multi-step process to identify leads, qualify them and then turn them into potential opportunities and, finally, customers?

Next, I want to be sure the economics make sense by exploring key questions such as:

  • What will they spend to acquire each new customer?
  • How valuable is each new customer they are acquiring?
  • What supporting data do they have?

I find that it’s hard not to land at looking for some type of Customer Lifetime Value (LTV) to Customer Acquisition Cost (CAC) analysis. While a LTV to CAC analysis is often used for a unit economic analysis for Software-as-a-Service (SaaS) businesses, I’ve seen it effectively applied across many industries. In the presentation, I walk through a high-level LTV to CAC example.

(4) Are expectations set too high?

With this fourth question, I try to gain a sense of whether I think the startup will beat or miss the operational milestones they are laying out in their investor deck, including:

  • Revenue targets and/or sales goals;
  • Number of users;
  • Number of cities they enter;
  • Number partnerships they develop;
  • When they turn profitable; and
  • Number of employees they can hire to scale.

Key questions I will ask include:

  • Can this team execute?
  • What about the team’s history of delivering on expectations?
  • Do they have a track record – i.e., are they second or third time founders?

Expectations are important because, simply put, if you miss them, investors will lose confidence. Conversely, if you beat expectations, investors will gain confidence. There is reputation risk if a startup misses expectations materially or repeatedly in that the next investment round may be a down round at a lower valuation or the startup won’t be able to raise funding at all.

It’s a startup founder’s role to “manage expectations” and walk the tightrope of being aspirational with the company’s vision and goals while not setting them too high that they routinely miss them.

Conclusion: How do we apply all of this?

For a startup founder, I find that the “comp set” derived through question #1 often reflects their ideal valuation multiple while, for an investor, their target return derived in question #2 can cap the valuation at a lower multiple. In this scenario, my view is that the founder’s multiple can be the ceiling while the investor’s multiple can be the floor for the valuation conversation. Then, the more compelling the answers are to question #3 (How viable is the customer acquisition strategy?) and question #4 (Are expectations set too high?), the more likely investor demand will rise lifting the round’s valuation multiple towards the ceiling. Without compelling answers, valuation will be pressured down or the round won’t get done at all.


Copyright 2018 Neil Portus | Please see our disclaimers.
Is e-scooter startup Bird worth $2 billion? Yes but only if it can do something most other B2C mobility companies cannot


Visit our store to download a free copy of this Excel financial model for an e-scooter startup.
This article was featured on the Autonomy.Paris Urban Mobility Daily newsletter.

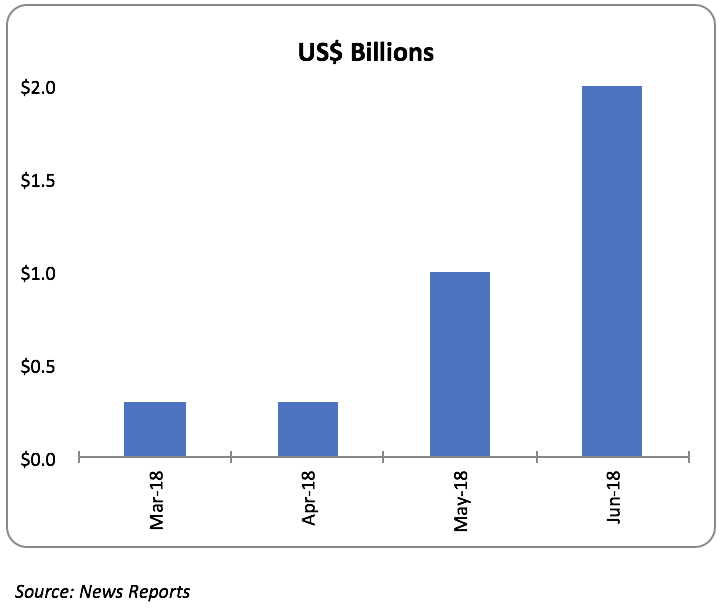
No doubt you have read recent news reports that e-scooter startup, Bird, raised $200 million from investors in June at a valuation close to $2 billion, only one month after it raised $100 million at a valuation close to $1 billion and three months after it raised $100 million at a valuation close to $300 million. Naturally, many people are wondering, “how is Bird already worth $2 billion??”

Chart 1: Bird’s Valuation Since March 2018

I had the same question too. So, I delved into the numbers and, to my surprise, realized that I was indeed able to reach a $2 billion valuation. I even built my own three statement financial model for a hypothetical e-scooter startup.

However, to reach $2 billion, I had to make one critical assumption which contradicts both my experience as a consumer of mobility services and my time as a Wall Street equity analyst covering car rental and mobility stocks. It’s something which I think is the Achilles heel of most B2C (business-to-consumer) mobility services such as ride hailing, car sharing, car rental, peer-to-peer car sharing, carpooling and bike sharing:

They have no pricing power.

Put another way, my perspective is that most B2C mobility services have no consistent ability to raise prices while simultaneously growing their market share. Pricing power is one way a company’s customers can demonstrate their brand loyalty. However, I believe that consumers view many of these mobility services as commodities with no material difference in the service or product offering from one company to the next. As a result, I often observe that a primary avenue for a competitor to capture market share is to step-in and undercut on price. With customers ready to jump ship as soon as a cheaper, viable alternative emerges. Further compounding the problem can be sector dynamics which lead to supply exceeding demand thereby putting additional pressure on pricing. During my work as an equity analyst, I observed US car rental companies over-suppyling the market for a variety of reasons: a pursuit of market share at the expense of profits; holding on to older cars longer so they don’t have to sell them during a period of declining used car values; and free cancelations and fluctuating seasonal demand which made it difficult to optimize fleets.

I’m sure you’ve heard of the adage “Better, Cheaper, Faster” with the tagline that, as a consumer, you can have two but not all three. However, as a mobility consumer, I consistently want to get places better, cheaper and faster:

* I find myself often booking the airline offering the lowest fare. Years ago, I would spend over $1,000 in the summer to fly round trip from New York City to Europe while, this year, I spent approximately $750 on new low-cost, long-haul airline Norwegian Air;
* For years, I booked rental cars on Priceline in search of the lowest bidder; and
* Several years ago, like many New Yorkers, I swapped the city’s yellow cabs for an Uber and, more recently, Lyft — as new mobile technology provided a cheaper, more convenient alternative.

One arena where I have observed pricing power is with monopolistic mobility services like New York City’s CitiBike. They are better positioned to raise prices and increase market share. Notably, annual CitiBike memberships have risen in cost to $169 currently from $95 in 2014 when the service launched.

With all of this in mind, I set out to build a financial model to see if I could:

(1) Value a hypothetical e-scooter startup at $2 billion; and
(2) Show what impact a lack of pricing power could have on that valuation.

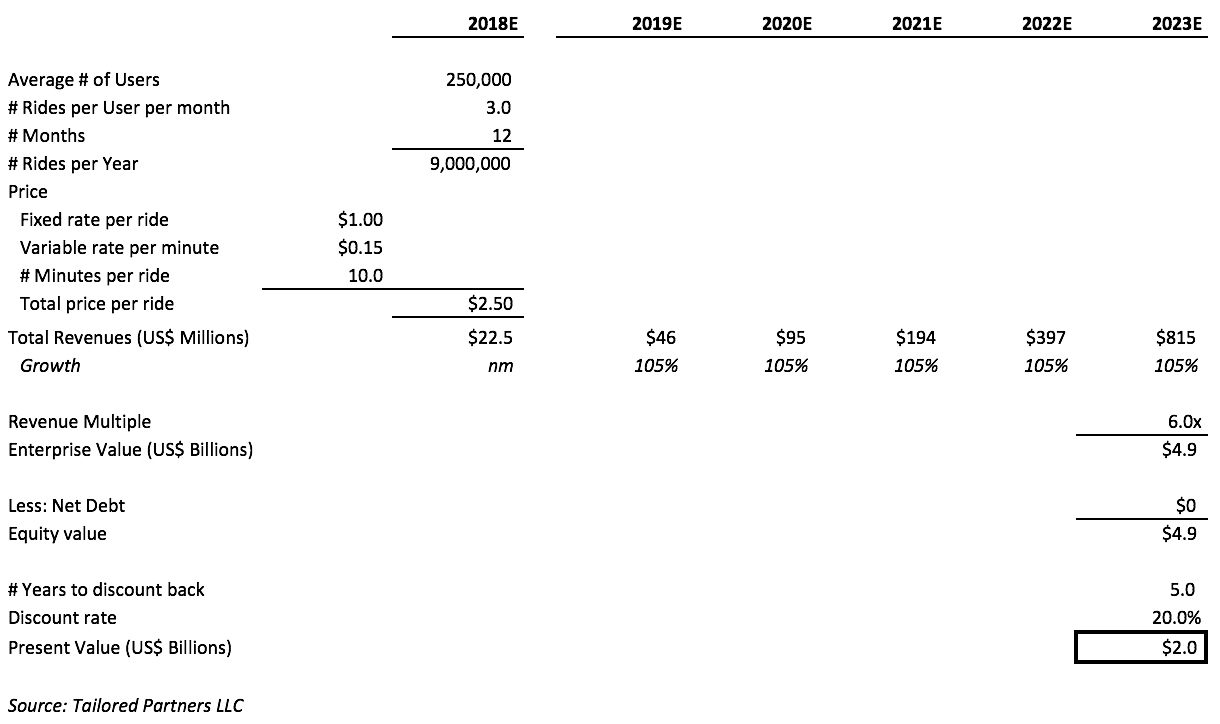
First, I essentially backed into a $2 billion valuation and, while lofty, discovered that the assumptions are not unbelievable when broadly compared to Uber. In year one of my hypothetical e-scooter startup, I assume the business has a healthy start and adds 500,000 new recurring users resulting in an average of 250,000 users for the year who take three rides per month at an average total price of $2.50 per ride. This yields $22.5 million in annual revenue (250,000 average users x 3 rides per month x 12 months x $2.50 total price). Bird’s pricing is $1.00 (fixed) plus $0.15 per minute (variable) which I mirror and assume each ride is 10.0 minutes to reach a total price per ride of $2.50 in the first year. Next, if net revenues have an average net growth rate of 105% for the next 5 years, the company will generate $815 million in revenues at the end of its sixth year ($22.5 million x 2.05^5). At a 6 times revenue multiple, the business will have an enterprise value of $4.9 billion which, if discounted back five years at 20% and assuming the company has no debt, yields a present equity value of $2.0 billion ($4.9 billion / 1.20^5). This illustration is more simplified than my model but shows the growth needed.

Chart 2: Reaching a $2 billion valuation for my hypothetical e-scooter startup

Testing two additional scenarios: Because there is limited data on the number of recurring users (i.e., someone who routinely uses the service, say, 3 times per month as I’ve assumed above) Bird has added during its first year of operations, I tested two additional scenarios noting that Google Play shows over 500,000 Android downloads and the Apple App Store shows over 185,000 iPhone reviews for Bird’s app (not everyone leaves a review so this indicates a higher number of downloads). However, just because someone downloads the app does not mean they are routinely using the service. That said, if my hypothetical e-scooter startup ends its first year with 1.0 million or 1.5 million new users (versus the 500,000 assumed above) who use the service 3 times per month at a total price of $2.50 per ride, then the annual net revenue growth rates needed to reach a $2 billion valuation using a 6 times revenue multiple are approximately 80% and 65% respectively.

These assumptions are lofty but investors are making a big bet. For an early mover in a disruptive service and a group of investors looking to get in on the ground floor, they are not unbelievable to me. I compare them to news reports that Uber raised $258 million in August 2013 at $3.7 billion valuation about five years after it was founded. This followed Uber achieving year over year net revenue growth of over 800% in both the first and second quarters of 2013 right before the raise. While I don’t know Uber’s forecasted forward net revenue number at the time of the raise, this valuation was 7.5 times Uber’s 2014 actual net revenue of $495 million.

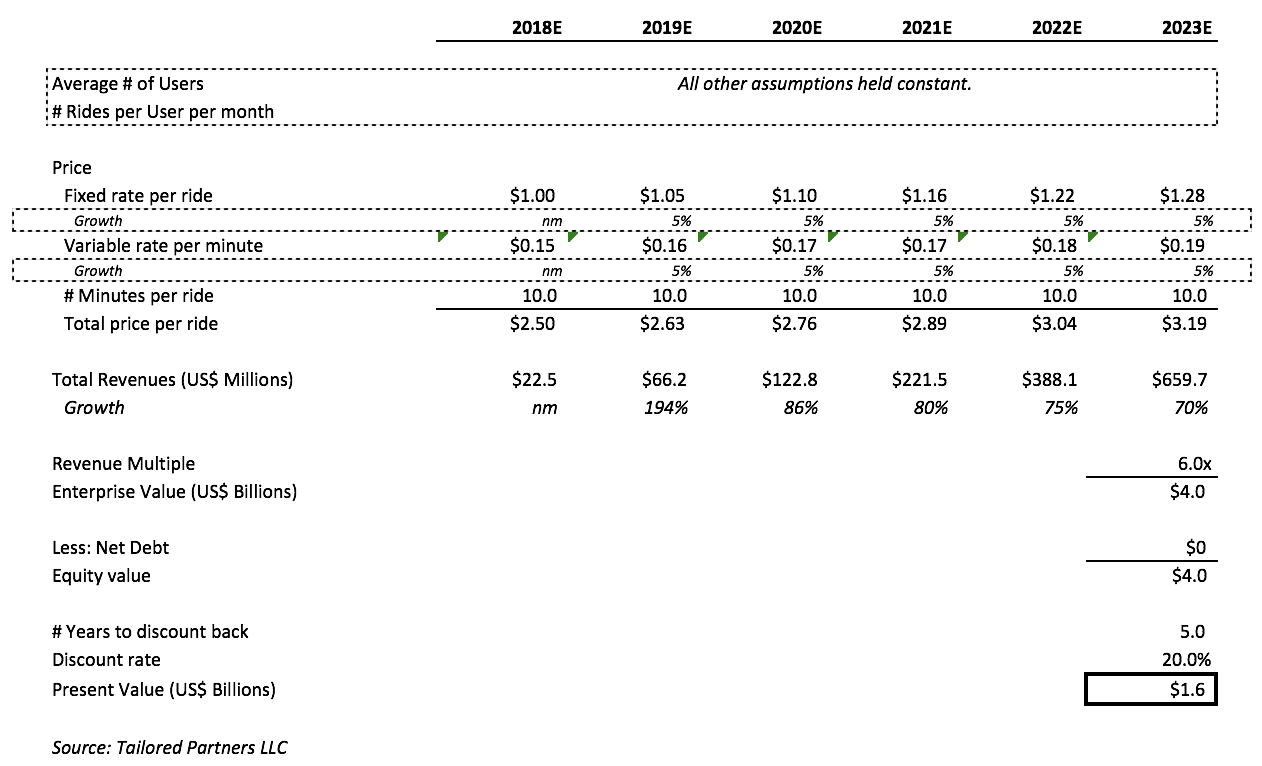
Second, though I fully anticipate that the lion’s share of revenue growth will come from adding new users rather than price increases, I wanted to show what impact a lack of pricing power could have on valuation (i.e., if the price per ride is lower than expected). As illustrated above, revenues in my model are driven by three metrics: (1) number of users; (2) number of rides per user per month; and (3) total price per ride (which is a function of rate x time). In my model which scaled to a $2 billion valuation based on 500,000 new users added in year one, one of my assumptions was that the fixed and variable rates would grow 10% annually from year one’s pricing of $1.00 per ride (fixed) plus $0.15 per minute (variable). By keeping the length per ride constant at 10.0 minutes, this meant the total price per ride grew from $2.50 in year one to $4.03 in year six. So, I held all assumptions constant (including the length per ride) and tested the impact on valuation of a reduced growth rate in the price per ride. I found that, for every 1% annual change in growth rate for the fixed and variable price rates, valuation increased or decreased by roughly $90 million (the impact per percentage point decreases as rates are lowered and increases as they rise). So, if the fixed and variable rates grew at 5% annually rather than 10% as initially modeled, this 5% decrease knocked off approximately $420 million (or approximately 21%) from valuation in my hypothetical e-scooter startup model. If you want to test your own assumptions and draw your own conclusions on pricing power, please visit our store to download a free copy of the model.

Chart 3: The impact on valuation from lower than expected price per ride

So, while I now better understand the bet Bird’s investors are making, I think the fly in the ointment for B2C mobility investors remains. If Bird can navigate early structural headwinds (i.e., scooters are illegal in some cities while others are impounding them or capping their numbers) and execute well, its success will attract even more competition whose primary path to build market share will be to deliver a similar experience while undercutting on price — with consumers ready to switch brands to take up this new offer. With news reports indicating that competitor Lime recently completed its own big raise of $250 million at a valuation close to $1 billion, able competition is already present.

I see this as a sector where few companies demonstrate long-term pricing power, and missing the mark by even a few percentage points will sour the investment case for most investors.


Copyright 2018 Neil Portus | Please see our disclaimers.